TEAMED (Technology Evaluating And Measuring Emotional Dysregulation)

Introduction
Emotional dysregulation is a key feature in a variety of conditions. These include brain injury and the dementias, as well as severe and enduring mental health problems such as schizophrenia and bipolar disorder. Medical management predominates but is of limited use in neurological conditions such as acquired brain injury and the dementias. Increased survival rates and longevity mean that these conditions are an increasing public health concern, affecting 11% of the adult population. Treatment of emotional dysregulation must be founded on accurate measurement of emotional state. By increasing awareness of patient mental state, medical staff are enabled to be more supportive and patients can use feedback to better regulate their emotions.
The TEAMED project (Technology Evaluating And Measuring Emotional Dysregulation) developed, integrated and assessedg a variety of technologies to establish a patient’s emotional state. The desired outcome was for patients with emotional problems to receive better care, to achieve a better quality of life, and to self-manage their conditions better.
The project was funded by the Digital Health and Care Institute from November 2015 to August 2016, though further evaluation is ongoing. The collaborators were the University of Stirling (Ken Turner and Evan Magill), Rapport Network CIC (Gary Cornelius) and the Brain Injury Rehabilitation Trust (Brian O'Neill).
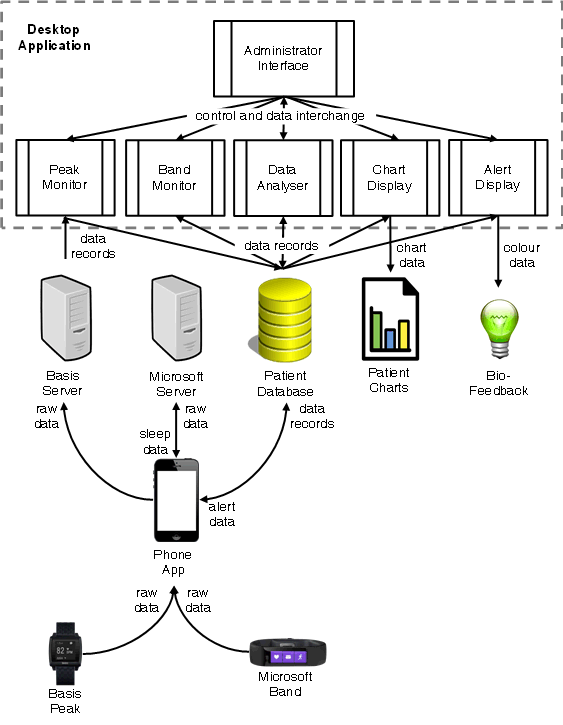
The overall structure of the TEAMED system is as follows:
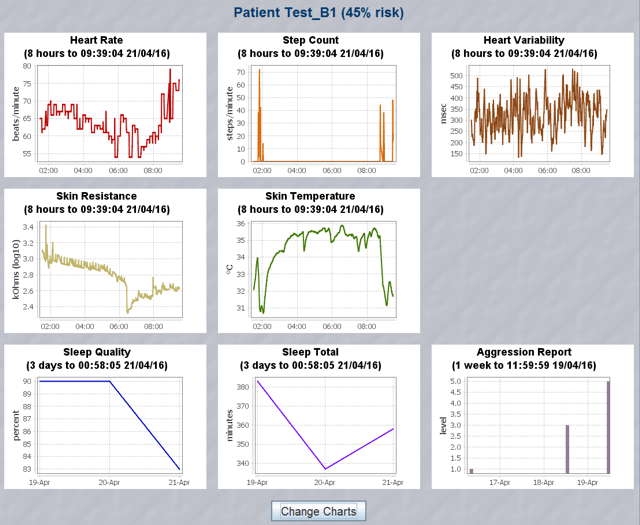
The following diagram shows the kind of data that is collected. This shows charts for a hypothetical patient with a 45% risk of an emotional episode:
A small-scale evaluation has been carried out in order to gain confidence in the approach and to establish whether emotional episodes can in practice be predicted. The evaluation was conducted with volunteer patients at BIRT (Brain Injury Rehabilitation Trust) in Glasgow. Further evaluation is ongoing in conjunction with BIRT.
Three patients at BIRT agreed to participate in the evaluation. The participants wore a Basis Peak or Microsoft Band watch and carried a mobile phone in a belt pouch. Data was collected over a period of 24 weeks. The total amount of data collected was 178 potential days of physical data (211,844 actual records) and 163 potential days of sleep data (105 actual records). In addition to this, medical staff entered 121 reports of aggressive episodes (423 actual records).
There were fairly frequent gaps in the data such that only 71% of potential physical data and 64% of potential sleep data was collected. For physical data the gaps ranged from tens of minutes to a few hours to a few days. Although this posed a challenge for the analysis it is probably typical of what can realistically be achieved in a clinical setting.
The overall aim of the work was to predict episodes of aggressive behaviour. A variety of classification approaches was investigated using different lengths of training data. The most accurate approach proved to be a Partial Decision Tree coupled with a cost matrix to compensate for the considerable imbalanace in data classes. (Periods with episodes are only a few percent of periods with normal behaviour.) The optimal cost for misclassifying an episode is computed automatically, though this can be fine-tuned manually.
The following table shows prediction performance averaged across all participants when using physical data. This gives the prediction accuracy for episodes and normal behaviour. The variation is shown for different training and actual periods: 1, 2 or 4 weeks for training and then actual performance in the subsequent 1, 2 or 4 weeks. The variation is also shown with different prediction periods: 1, 2, 3 or 4 hours ahead. Useful results were achieved with 4 weeks of training data and predictions 3 to 4 hours ahead. This gives medical staff adequate time to monitor a patient at risk and to intervene as appropriate. It suggests that the mechanisms that cause aggressive behaviour have a measurable physiological effect a few hours ahead of the actual aggression. Although performance is actually better with 2 weeks of training data and predictions up to 1 hour ahead, this would not give much warning of a potential problem and so was not selected.
| Training/Actual (weeks) | ||||||
| 1 | 2 | 3 | ||||
| Prediction (hours) | Episode | Normal | Episode | Normal | Episode | Normal |
| 0-1 | 75% | 16% | 81% | 42% | 35% | 64% |
| 1-2 | 75% | 16% | 91% | 9% | 41% | 53% |
| 2-3 | 100% | 17% | 64% | 64% | 60% | 45% |
| 3-4 | 75% | 16% | 41% | 59% | 68% | 42% |
The following table shows prediction performance when using sleep data; note that the prediction periods here are in days. The best performance was for 2 weeks of training data and predictions 3 to 4 days ahead. It is perhaps surprising that reasonably accurate predictions can be made so far in advance. The reason is partly because several nights of poor sleep can trigger an episode, and partly because episodes a few days ago are a reasonable predictor of future episodes.
| Training/Actual (weeks) | ||||||
| 1 | 2 | 3 | ||||
| Prediction (hours) | Episode | Normal | Episode | Normal | Episode | Normal |
| 0-1 | 25% | 84% | 82% | 42% | 47% | 59% |
| 1-2 | 60% | 9% | 82% | 63% | 90% | 21% |
| 2-3 | 25% | 75% | 80% | 60% | 72% | 38% |
| 3-4 | 60% | 91% | 82% | 68% | 69% | 49% |
After reviewing prediction results from the evaluation, staff of the clinical partner (BIRT) judged that the accuracy was acceptable and that the approach would be useful. Indeed it is a big improvement on the current situation where episodes are virtually unpredictable and cannot easily be anticipated by the staff. Furthermore, BIRT were pleased that they would receive adequate warning of possible aggressive episodes. BIRT report that when patients become aroused and aggressive they respond well to being 'talked down' and encouraged to relax. There is therefore a real opportunity for intervention by medical staff to head off an episode. Further work is ongoing to consider actual interventions based on the automated predictions.
Kenneth J. Turner, Brian O'Neill, Gary Cornelius, Evan H. Magill. Predicting Emotional Dysregulation. Technical Report CSM-200, Computing Science and Mathematics, University of Stirling, September 2017.
 Up one level to
Ken Turner - Research Projects
Up one level to
Ken Turner - Research Projects